Over the past decade, social media has become an important part of modern life. But how much attention do people actually pay to Facebook, Instagram, YouTube, or TikTok? Statistics from Influencer Marketing Hub reveal impressive numbers about the overall picture as well as each individual social media platform. While some people are still not keen on this form of media, millions of people around the world have considered social media an indispensable tool in their daily lives.
Social Media Overview by 2024
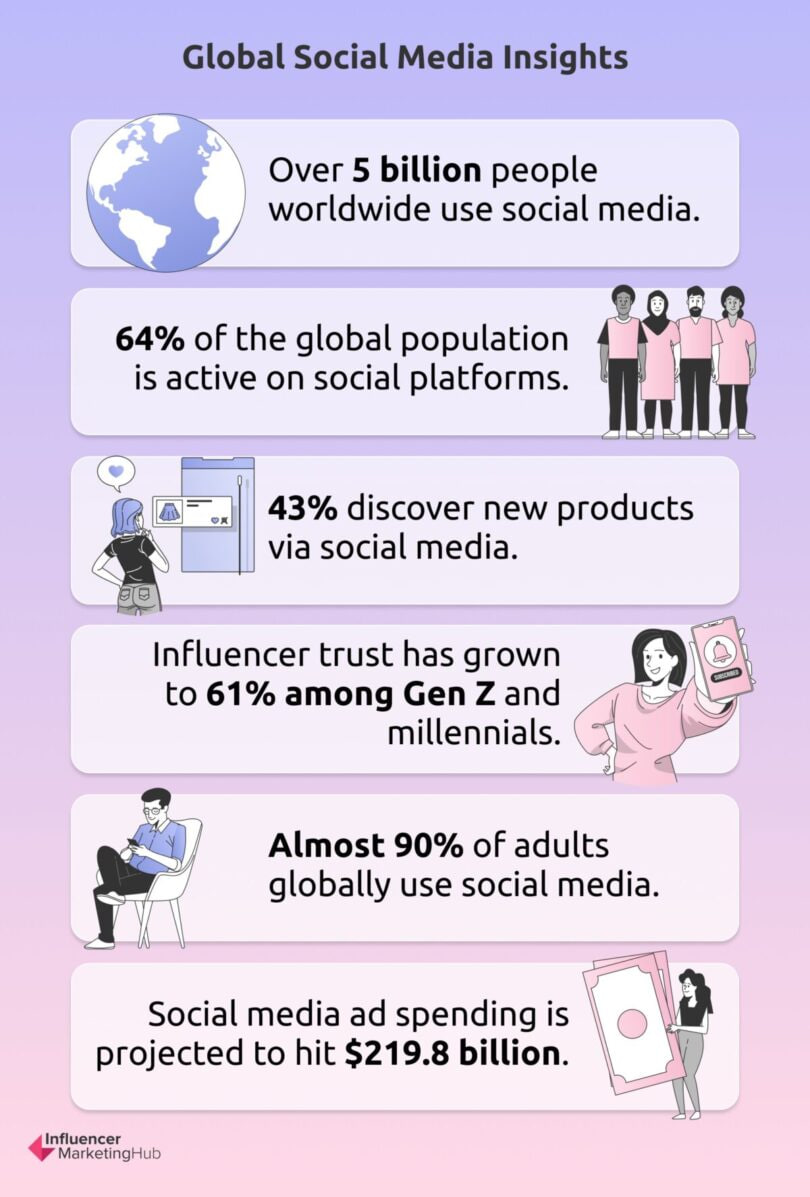
- As of July 2024, there are 5.17 billion people worldwide using social media. It is estimated that about 64% of the global population is active on social media platforms.
- People spend about 14% of their waking hours on social media. In total, the world spends more than 12 billion hours a day on these platforms, equivalent to more than 1.38 million years of human life.
- On average, people use 6.7 social media platforms each month. Nearly 9 in 10 adults worldwide use social media.
- The main reason people use social media is to stay in touch with friends and family, with over 49% of users saying this is their main purpose. Around 38% use social media for entertainment, 34.3% for news. One in five people follow celebrities and influencers on these platforms.
- Not only are people spending more time on social media, they’re also engaging more with brands. Social media use for product discovery is up 43%, product research is up 42%, and purchases are up 36%.
- Trust in influencers is on the rise. The number of Gen Z and millennials who trust social media influencers has increased from 51% in 2019 to 61% in 2023. Brands are relying on influencers to reach Gen Z, with 46% of them following more than 10 influencers on social media.
- Facebook will still be the dominant social media platform in 2024, with over 3 billion monthly active users.
- After Facebook, YouTube has 2.5 billion monthly active users. Instagram and WhatsApp are third with 2 billion users. TikTok is growing with 1.6 billion users, while WeChat has 1.3 billion users, mostly in China.
- YouTube has the largest advertising audience on social media, with 2.5 billion monthly users, 10% more than Facebook (2.24 billion).
- Social media affects mental health in many ways and is often criticized for being addictive. It encourages comparison and a constant need for validation. Fear of missing out (FOMO) contributes to anxiety and depression, as feelings of exclusion can impact thoughts, emotions, and physical health.
Looking back at the rise of social media over the years
11. In 2024, there will be 5.17 billion social media users, up 4.44% from 4.95 billion in 2023
12. By 2024, the average daily time spent on social media will be 143 minutes.
13. The number of social media users will increase by 5.6% with 266 million new users joining by 2023, an average of 8.4 new users every second.
14. Comparison of social media usage among US adults from May 2023 to January 2024:
- YouTube increased from 68% to 71%
- TikTok increased from 34% to 37%
- Facebook drops from 71% to 68%
- X (Twitter) dropped sharply from 30% to 23%
- Instagram increased slightly from 40% to 42%
- Other platforms like Reddit, LinkedIn, Tumblr, Twitch, Snapchat, and Pinterest have changed little or remained the same.
15. From 2022, social media shows that it is expanding its reach to all age groups, not just young people:
- Facebook & LinkedIn: Have the oldest user base and continue to grow.
- Pinterest: Similar trend with increasing median age.
- X (Twitter): Initially attracted a young audience, but the median age is increasing.
- Instagram: From a platform popular with young people, now attracting more ages.
- TikTok: Initially aimed primarily at young people, but is slowly expanding to other age groups due to its rapid growth and wide reach
Social Media Demographic Analysis: Global User Gender Ratio Is 53.4% Male and 46.6% Female
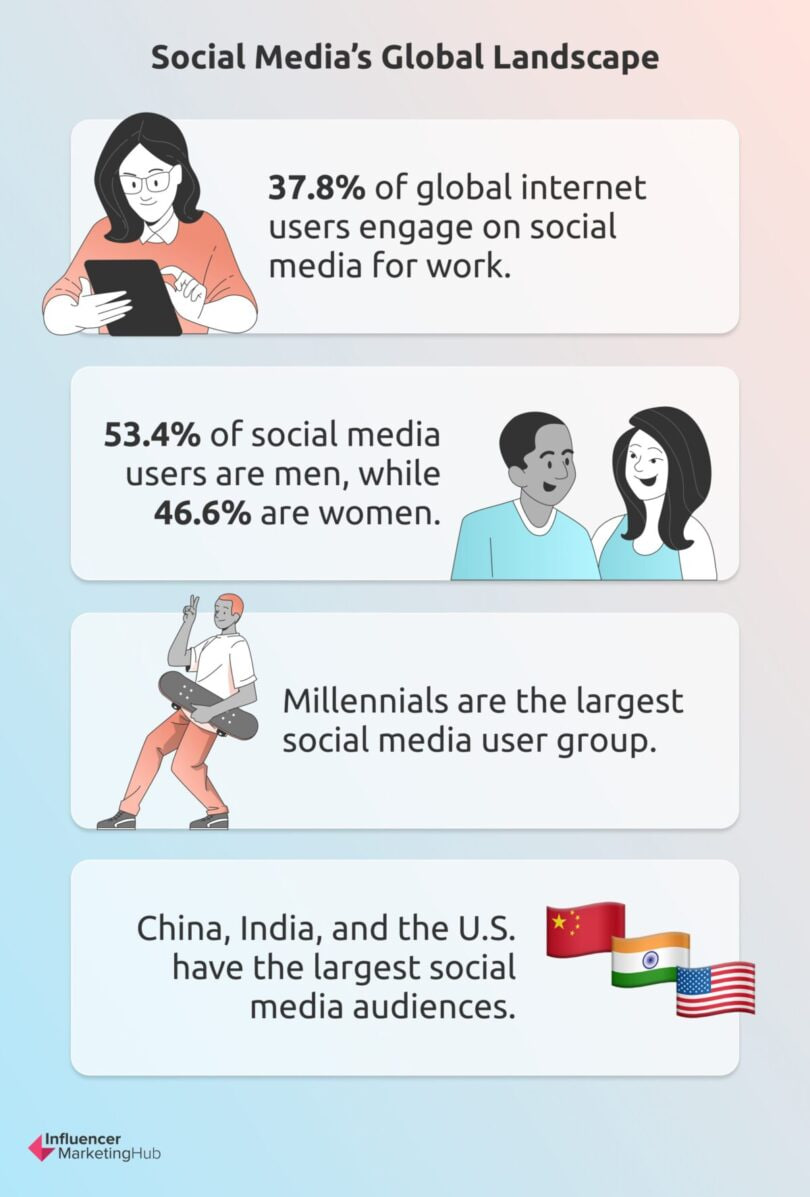
16. Globally, 37.8% of internet users use social media for work.
17. The gender ratio of social media users worldwide is 53.4% male and 46.6% female.
18. Millennials remain the largest group of social media users, with their numbers expected to reach 68.8 million by 2024, up 0.44% from 2023. Gen Z follows closely behind.
19. On average, people over the age of 16 use 6.7 social media platforms per month. The 16-24 age group has higher usage, with an average of 7.4 platforms per month. In the study of 53 countries:
- Japan has the lowest usage (3.5 platforms).
- Brazil has the highest usage (8.0 platforms).
- Northern Europe has the highest rate of social media usage among internet users, at 80.2%. This is followed by: Western Europe: 78.2% and East Asia: 74.9%.
20. China leads the world in the number of social media users with 1.07 billion people. The following countries are:
- India: 862 million users
- USA: 308 million users.
- It is predicted that by 2029, India will surpass 1.3 billion social media users, becoming the country with the largest social media community in the world.
Social Media Advertising and Marketing Trends for Marketers
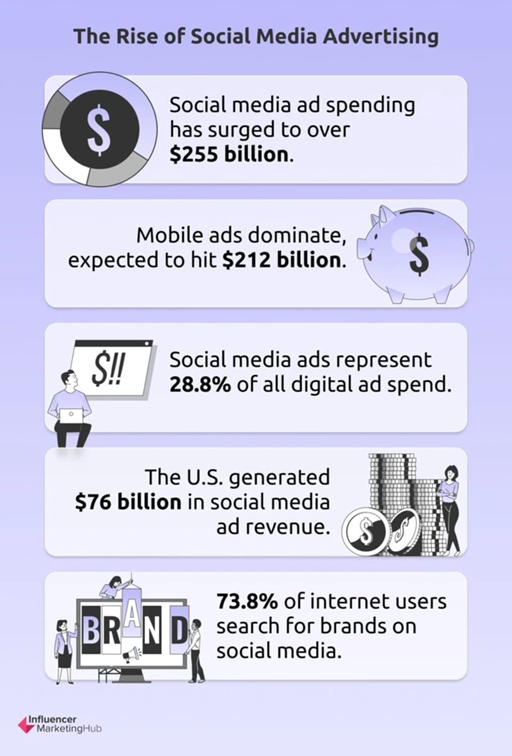
21. Social media ad spending has skyrocketed, from $51.3 billion in 2017 to a projected $255.8 billion by 2028. Mobile advertising leads the trend, with spending forecast to reach $212.68 billion by 2028.
22. Mobile advertising has surpassed desktop advertising as the primary advertising channel on social media. By 2023, the majority of social media ad spend will be on mobile, and this trend will continue to grow.
23. Social media plays a vital role in brand discovery:
- 27% of consumers learn about brands through social media advertising.
- 22% discovered a brand through recommendations or comments from others, underscoring the power of social proof.
24. 73.8% of internet users globally search for brand information on social media platforms. Here are the search volumes by platform type:
- Social media: 45.5%
- Q&A sites (Quora, etc.): 18.9%
- Messaging & Live Chat Apps: 14.5%
- Forums & Message Boards: 13.8%
- Micro-blogging (like X – Twitter): 13.4%
- Video blogs (Vlogs): 12.3%
- Content pinning sites (Pinterest, etc.): 9.4%.
25. Frequency of posting by brands on each social media platform:
- Facebook: 5.04 posts/week (down slightly from last year). Media companies and sports teams post more.
- Instagram: 4.6 posts/week (slight increase from last year). Sports groups are more active.
- TikTok: 1.75 videos/week. Media, beauty, and health brands post more.
26. More than 20% of social media users globally cite livestreaming as their primary reason for using the platform.
- In the APAC region, consumers are 51% more likely to shop via livestream than the global average.
- Live shopping delivers high ROI for brands, creating engaging interactive experiences that drive sales.
- APAC shoppers also tend to be loyal and favor brands that offer direct shopping features.
Facebook still holds the “throne” in terms of number of users
27. Data from Statista shows that Facebook has 2.1 billion daily active users in Q4 2023. This means that these users access Facebook or one of the platform’s core products at least once a day.
28. Facebook’s monthly active users (MAUs) reached 3.05 billion, according to the Global Overview Report.
29. India is the country with the largest number of Facebook users, with 378.05 million users as of April 2024. The US is second with 193.8 million users. Meanwhile, Indonesia is third with 119.05 million users.
30. More than 10 million advertisers are using Meta’s advertising services on Facebook.
31. Only 1.5% of Facebook users access the platform using a laptop or desktop computer, with the majority using mobile devices.
32. 64.1% of Facebook Android users open the app daily. On average, users spend 19 hours and 47 minutes per month on the Facebook Android app, making it the third most time-consuming social media platform, behind only TikTok and YouTube.
33. Facebook is a popular platform for businesses, with 91% of organizations globally having a Facebook account. It is also the most used social network for news, although its popularity has declined in recent years.
34. The most followed Facebook page is Facebook itself with 188 million followers.
- Cristiano Ronaldo is the most followed person on Facebook, with 170 million followers.
- Netflix has been leading in likes, comments and shares in the US for many years.
X sees a decline in advertising revenue
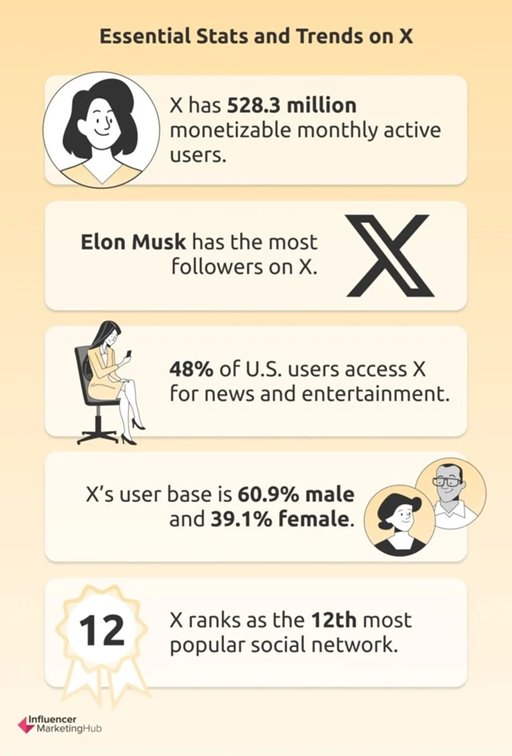
35. In 2022, X generated $4.73 billion in advertising revenue. This number is expected to decline to $2.7 billion by 2027. X currently accounts for about 1% of global advertising revenue.
36. Unlike Facebook, Twitter’s largest user base is in the United States with 76.9 million users. Japan has the second largest user base based on the number of Twitter users (58.95 million), followed by India in third place (23.6 million) and Brazil in fourth place (19.05 million).
37. As of August 2023, Elon Musk has the most followers on X, with over 140 million followers. Former US President Barack Obama is second with 132.6 million followers and Justin Bieber is third with 112.73 million followers. The athlete with the most followers is none other than Cristiano Ronaldo with 108.59 million followers.
38. The most liked tweet of all time was posted in August 2020 to announce the death of Chadwick Boseman. To date, the tweet has received 6.7 million likes. The second most liked tweet is from Elon Musk. The tweet that said “Next I’m going to buy Coca-Cola to bring back cocaine” was posted in late April 2022 and received 4.5 million likes.
39. As of January 2024, 60.9% of X users are male and 39.1% are female. There is no current data on non-binary users and other gender identities.
40. X is the 12th most popular social network.
YouTube Becomes Top Social Network Ranked by Brand Awareness
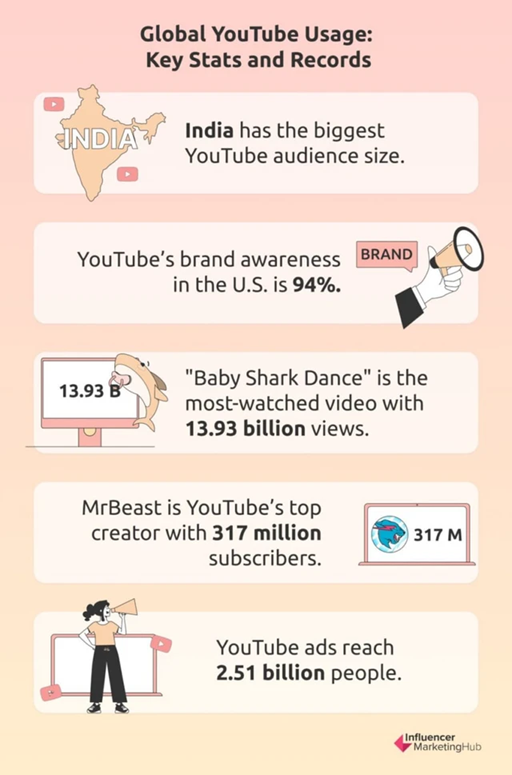
41. India has the largest YouTube audience. As of July 2024, it had 476 million subscribers, followed by the United States with 238 million and Brazil with 147 million.
42. In 2024, global users will spend an average of 29 hours per month on the YouTube mobile app. The average time spent per user on the Android mobile app per month is 23.1 hours.
43. YouTube brand awareness is estimated to reach 94% in the United States, making YouTube the top social network ranked by brand awareness in the United States by 2023. Of the 94% of people familiar with YouTube, 67% said they liked the platform.
44. The most viewed video on YouTube is “Baby Shark Dance” by Pinkfong Kids’ Songs & Stories. As of January 2024, it has 13.93 billion views. Furthermore, it is the first video on YouTube to surpass 10 billion views. It is followed by “Despacito” by Luis Fonsi ft. Daddy Yankee (8.54 billion views), while “Johny Johny Yes Papa” by LooLoo Kids is third with 6.86 billion views.
45. BTS’s “Dynamite” reached over 101 million views in its first 24 hours, setting a new record for the biggest music video debut
46. According to Awesome Creator Academy, there are about 59,340 YouTube channels with more than 1 million subscribers.
47. MrBeast is the most subscribed YouTube channel. The American videographer and internet personality has surpassed T-Series, the largest record label and film studio in India. The channel has 274 million subscribers to date. YouTube Movies rounds out the top three with 183 million subscribers.
48. In Q1 2024, YouTube users watched an estimated 922 million hours of live gaming content and 41.5 million hours of live gaming content.
49. As of July 2024, T-Series is the owner of the most-viewed YouTube channel of all time, with over 260.12 billion views.
50. YouTube is more popular among men. As of July 2024, about 54.3% of users are male compared to 45.7% who are female.
51. 47% of Gen Z have watched fan-made videos about specific content, artists, or public figures in the past year
52. 36.9% of people aged 18 and over worldwide now use YouTube.
53. In Q2 2024, more than 842.8 million comments were removed from YouTube. The biggest reason was spam, with 80% of deleted comments classified as spam or misleading content. Of those, child safety accounted for just 5%.
Instagram Sees Massive Growth With #love Being the Most Popular Hashtag
54. As of January 2024, India is the country with the largest number of Instagram users with 362.9 million accounts.
- The US ranks second with 169.65 million users.
- Brazil ranks third with 134.6 million users.
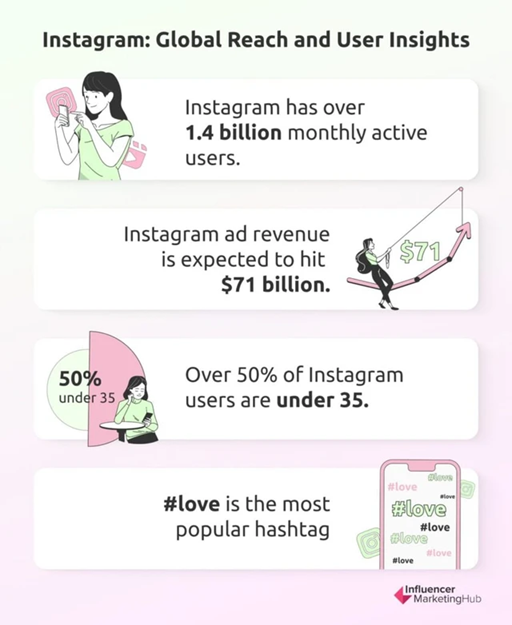
55. The potential audience for Instagram advertising is 1.63 billion users.
- Instagram Stories ads reach nearly 1 billion people/month.
- Instagram Reels ads reach about 800 million people/month.
56. Instagram ad revenue is expected to reach $71 billion by the end of 2024. Bahrain has the highest Instagram reach in the world, with 95.6% of its population using the platform.
57. More than half of global Instagram users are under 35 years old. 16.5% of global Instagram users are men aged 18-24.
58. Percentage of Instagram users by age group (April 2024):
- 18-24 years old: 16.5% male – 15.2% female
- 25-34 years old: 16.4% male – 14.2% female
- 35-44 years old: 7.9% male – 8.1% female
- 45+ years old: Female majority
59. The average time spent on Instagram in 2024 is 33 minutes/day, double the 15 minutes/day in 2019. More than 500 million users open the app every day.
60. The average engagement rate for posts from business accounts on Instagram is 0.56%.
- Carousel posts (multiple images) have the highest engagement rate: 0.69%.
- Image posts have the lowest engagement rate: 0.50%.
61. Most Liked Posts on Instagram (April 2024):
- Photo of Lionel Messi celebrating World Cup 2022 victory – 75.4 million likes.
- Legendary egg post (2019) – 60.1 million likes.
- Messi in bed with FIFA World Cup trophy & Mate drink – 54.5 million likes.
62. Most followed accounts on Instagram (September 2024):
- @Instagram – 676 million followers.
- Cristiano Ronaldo – 640 million followers.
- Lionel Messi – 504 million followers.
- Selena Gomez – 424 million followers.
63. Most popular hashtags on Instagram (January 2024):
- #love appeared in over 2 billion posts.
- #Instagood & #Instagram both have over 1 billion posts.
User time spent on TikTok is the highest of all social media platforms
64. The potential audience for advertising on TikTok is about 1.092 million people.
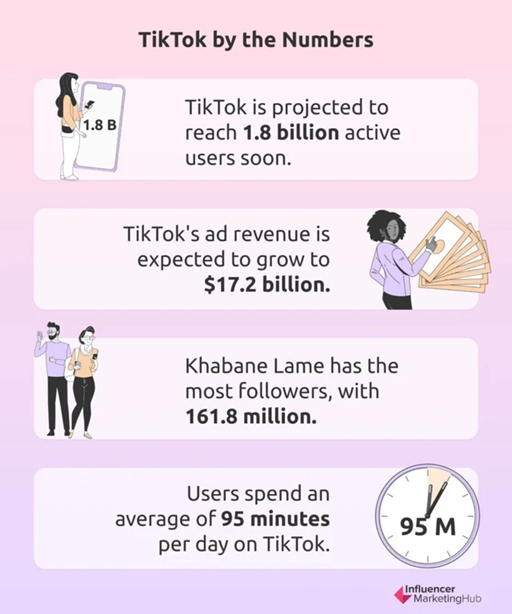
65. TikTok ad revenue is expected to reach $17.2 billion by 2024, up 30.7% year-over-year.
- Growth has slowed from a 155% increase in 2022.
- Advertising revenue is expected to reach $22 billion by 2025.
66. Countries with the most TikTok users (July 2024):
- Indonesia – 157.6 million users
- US – 120.5 million users
- Brazil – 105.2 million users
67. According to Business of Apps, TikTok is the highest-grossing app in 2023, generating $2.7 billion.
68. Average monthly time spent on TikTok on Android: Global: 23.5 hours/month, Highest in Australia: 29.6 hours/month
69. TikTok user share by age (July 2024): Female 18-24 years old: 16% of total global users; Male 18-24 years old: 19% of total global users
70. TikTokers with the most followers (2024):
- Khabane Lame – 161.8 million followers
- Charli D’Amelio – 151.6 million followers
- Bella Poarch – 93.7 million followers
70. Average time users spend on TikTok daily: 95 minutes, highest of all social networks.
71. Average time users spend on TikTok daily: 95 minutes, highest of all social networks.
Pinterest has become the fastest growing social network, acting as a search engine rather than just a social network.
72. Pinterest is the 15th most popular social network in the world (as of January 2023). Women make up the majority of Pinterest users, with 69.4% being female and 22% being male (as of April 2024).
73. The US is Pinterest’s largest market, with nearly 90 million users (April 2024), far ahead of Brazil in second place with 38.9 million users.
74. Pinterest has the potential to reach nearly 282.5 million people through advertising.
75. Gen Z is the fastest growing user group, accounting for 42% of all users and tends to search and store products more than other generations.
76. 96% of searches on Pinterest are unbranded, suggesting that users are more interested in products and ideas than specific brands. Pinterest users are 55% more likely to buy a product after watching a video on the platform, compared to other social networks.
77. Pinterest posts have a lifespan of 6 months to over a year, much longer than Facebook, Instagram or TikTok, because Pinterest acts as a search engine instead of just a social network.
LinkedIn is the world’s largest professional network – An effective talent search tool
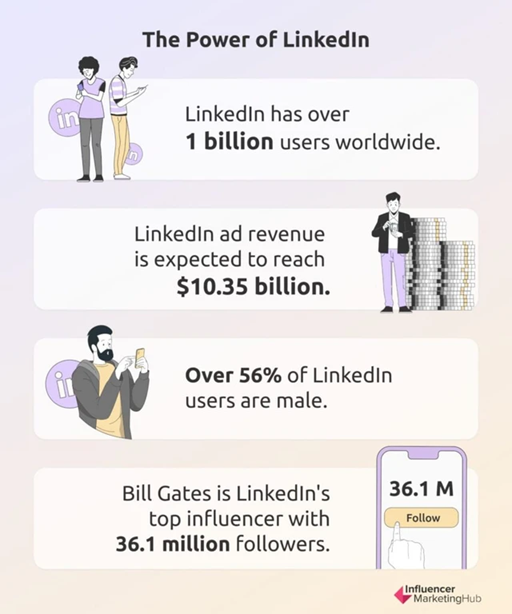
78. LinkedIn is the world’s largest professional network, with over 1 billion users in 200+ countries and territories.
79. The US has the largest number of LinkedIn users, with 230 million users (as of April 2024), followed by India with 130 million.
80. LinkedIn’s advertising revenue is expected to reach $10.35 billion by 2027. 2024.
81. Men make up a higher percentage of LinkedIn users, with 56% being male and 43% being female (as of January 2024).
82. People with the most followers on LinkedIn: Bill Gates (36.1 million), Richard Branson (18.7 million), Satya Nadella (11 million)
83. Every minute, 138 hours of learning content are consumed on LinkedIn. Also, every minute, 9,000 job applications are sent, and 7 people are hired through LinkedIn.
84. Companies use LinkedIn to find talent, with over 41,000 skills listed on candidate profiles.
85. LinkedIn has 18,500 full-time employees and 38 offices in more than 30 cities around the world, much larger than Pinterest.
86. 76% of video marketers use LinkedIn in their marketing strategy.
87. The best time to post on LinkedIn is Tuesday through Thursday, 10am-12pm. Weekends have the lowest engagement.
The wave of Influencer Marketing is growing strongly
88. Only 13% of global consumers say influencer recommendations make them more likely to make a purchase, while 40% prefer discounts. Additionally, 84% of influencer shoppers avoid using affiliate links and prefer to go directly to the brand’s website.
89. TikTok is the leading platform for influencer marketing, used by 69% of brands, surpassing Instagram (47%), YouTube (33%) and Facebook (28%)
90. Brands prioritize working with small influencers: 44% choose nano-influencers (up from 39%), 25.7% choose micro-influencers (down from 30%). Fewer brands are working with large influencers, with 85.8% now having a budget for influencer marketing, compared to just 37% in 2017.
Source: Influencer Marketing Hub
Comment Policy: We truly value your comments and appreciate the time you take to share your thoughts and feedback with us.

Note: Comments that are identified as spam or purely promotional will be removed.

To enhance your commenting experience, consider creating a Gravatar account. By adding an avatar and using the same e-mail here, your comments will feature a unique and recognizable avatar, making it easier for other members to identify you.

Please use a valid e-mail address so you can receive notifications when your comments receive replies.