
Smartphones and tablets are the devices to watch. They represent a large portion of all email interactions and revenue . But how large? This article takes a look at all the available (useful) statistics and compiles the ultimate mobile email statistics overview with an in-depth look at the current state of mobile email.
These numbers will continue to change, almost every day. The figures were last updated in December 2023, so please refer to this article for reference purposes!
Ultimate mobile email usage statistics
Basic mobile email usage statistics: Mobile email will account for 26 to 78% of email opens, depending on your target audience, product, and email type. eMailmonday – “basic mobile email statistics” (2023)
Mobile Email Statistics: The Growth and Usage of Mobile Email
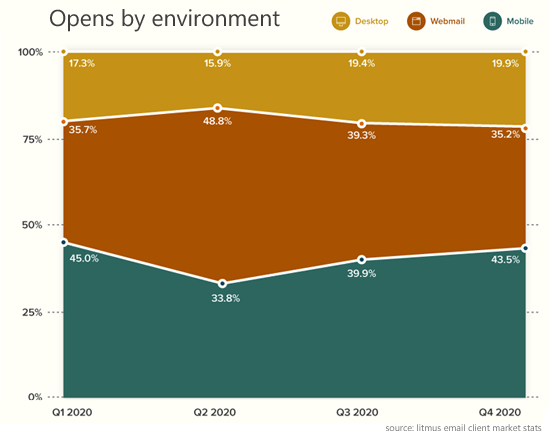
Mobile customers account for 41.6% of email opens , followed by webmail opens at 40.6% and desktop opens at 16.2% – Litmus “The 2021 Email Client Market Share” (Aug 2021).
Mobile email open rate was 19.04% in Q4 2020 , with 17.52 in Q1, 19.15 in Q2 and 18.51% in Q3 2020 – Team ITG “email Benchmark” (2021)
61.9% of email opens happen on mobile, 9.8% on desktop, and 28.3% on webmail clients. – Adestra “Top 10 email clients” (July 2019)
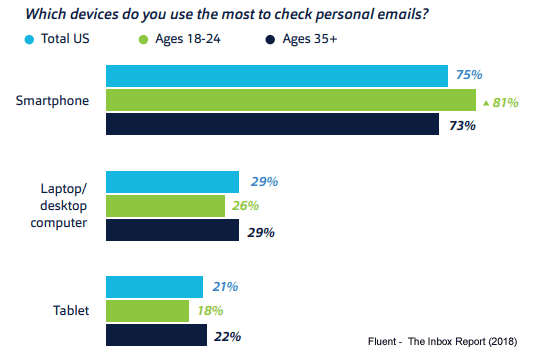
About 3 in 5 consumers check email on the go (mobile), and 75% say they use their smartphone most often to check email. – Fluent “The Inbox report, Consumer perceptions of email” (2018).
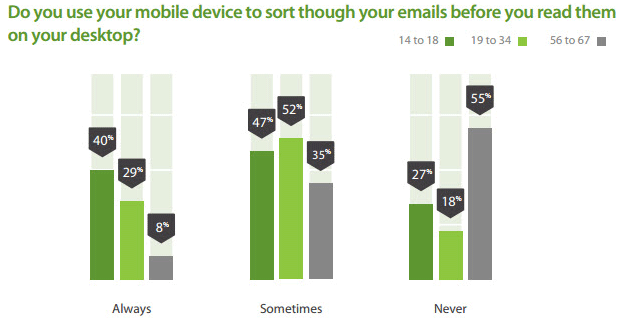
Email is always read first on mobile devices with an average of 25.6%. 40% of 14-18 year olds will always read email on mobile devices first, 29% of 19-34 year olds and 8% of 56-67 year olds. – Adestra “Consumer Adoption & Usage Study” (2016)
68.9% of recipients view marketing emails on their smartphones 2-3 days per week. – 250OK and 42labs “What recipients really think about your email marketing designs” (2018)
55% of consumers ages 56-67 say they will never read email on a mobile device first . That number drops to just 18% for the 19-34 age group. –Adestra “Consumer Adoption & Usage Study” (2016)
More emails are read on mobile devices than on desktop email apps . Statistics show that 42% of emails are now opened on mobile devices – Litmus “2021 Email Client Market Share” (Aug 2021)
On average, 47% of people use mobile devices to check email campaigns, while 26.9% use desktop and 26.1% use webmail. – ision6 “Email Marketing Metrics Report (Dec 2017)
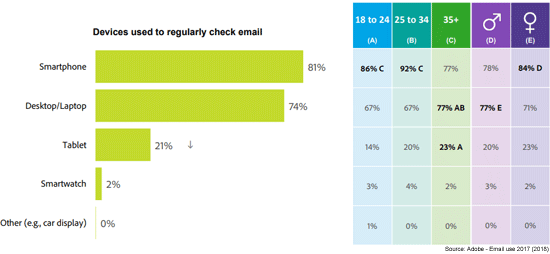
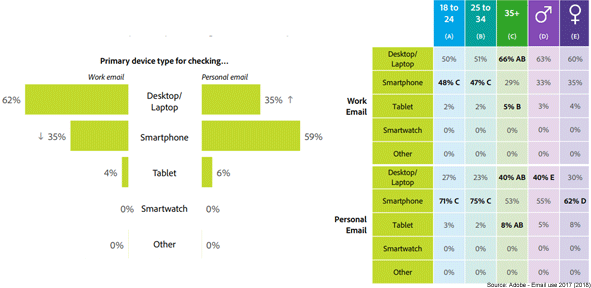
81% use smartphones to check email regularly. 21% use tablets . Smartphones are the most popular device, especially among young adults (under 35) and women. – Adobe “Email Use 2017 – US Report” (2018)
40% of consumers say mobile is their primary device for checking email . – The Relevancy Group “Inbox Evolution: Consumer email marketing trends and behaviors.” (2018)
More than 98 percent say they own some type of mobile device, and 86 percent of consumers say they access one or more of their email accounts via a mobile device . – The Relevancy Group “Inbox Evolution: Consumer email marketing trends and behaviors.” (2018)
Women interact with email more than a hundred million minutes per month more than the industry average . For each individual, that means women spend seven more minutes per month checking email on their smartphones than men. UKOM & Comscore data (2016)
Nearly 4 million adults do not use a desktop/laptop to access the internet. Younger audiences, women and parents are more likely to be ‘mobile-only’. UKOM Insights – UK Digital Market Overview March 2017 (2017)
The majority of emails are opened on mobile devices. According to Kahuna data, 86% of emails in Q1 2016 were opened on mobile devices. – Kahuna “The Kahuna Mobile Marketing Index” (Q1 2016)
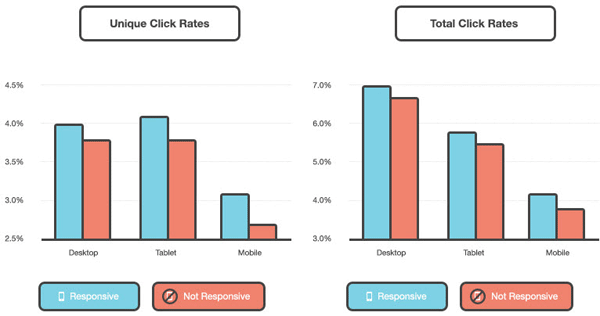
Responsive design resulted in a nearly 15% increase in unique clicks from mobile users, from an average of 2.7% to 3.3%. – Litmus and MailChimp “The Science of Email Clicks: The Impact of Responsive Design & Inbox Testing” (December 2014)
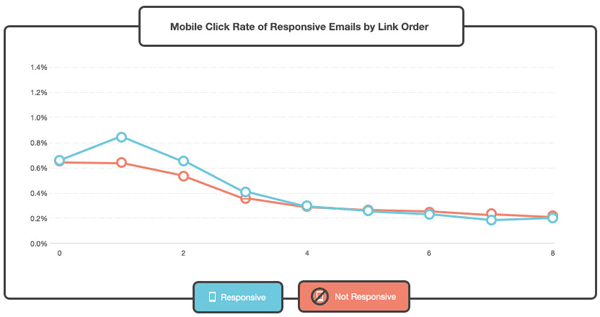
The first link in a responsive design email on mobile devices has a 30% higher click-through rate than a non-responsive design. – Litmus and MailChimp “The Science of Email Clicks: The Impact of Responsive Design & Inbox Testing” (December 2014)
iPhone is the most popular platform in the mobile email space (28.4%) , followed by Apple iPad (9.3%) and Google Android (2.3%) – Litmus “Email Analytics” (June 2019)
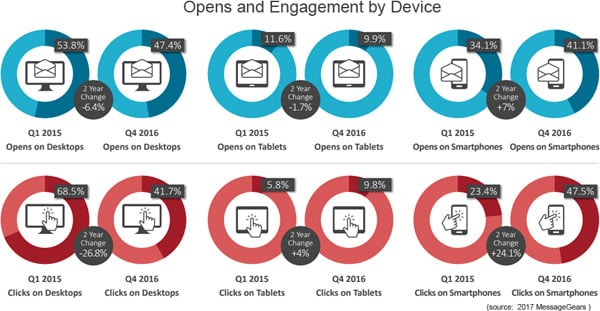
The percentage of total opens occurring on smartphones has increased by about 7% over the past year. – MessageGears “Mobile Email Engagement Is On The Rise” (2017)
Smartphone click-through rates are significantly higher than they used to be. More clicks now occur on smartphones (47.5%) than desktops (41.7%). – MessageGears “Mobile Email Engagement Is On The Rise” (2017)
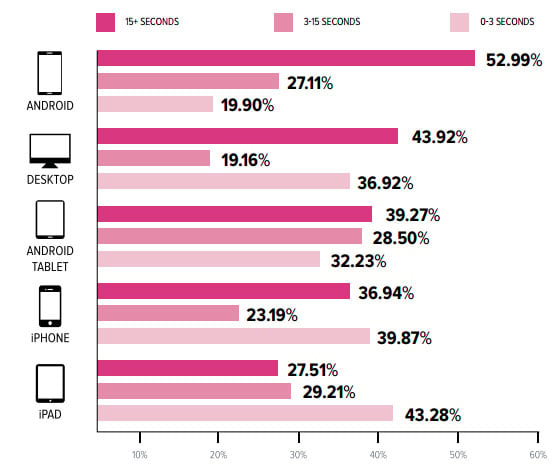
Android phone users spend the most time looking at email . Android smartphones, 52.99% of users spend 15 seconds or more looking at each message. Desktop users come in second, with 43.99% spending 15 seconds or more looking at email. Movable Ink “US Consumer Device Preference Report: Q2 2014” (2014)
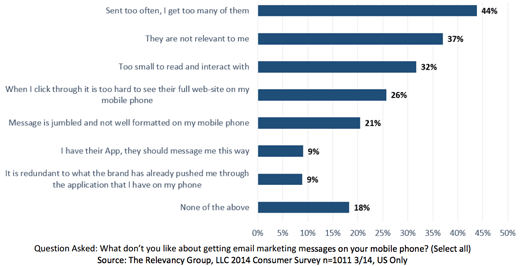
The biggest obstacles people face when using email on mobile devices are: Too much (44%), Irrelevant (37%), Too small to read and interact with (32%), Websites and landing pages not optimized for mobile (26%), and Not well formatted for mobile (21%) – LiveClicker and The Relevancy Group “Exploring the Benefits of Real-Time Email – Driving Marketing Effectiveness” (2015)
Responses sent from phones are 54% faster than responses sent from desktops. Mobile responses have an average response time of just 28 minutes, followed by emails sent from tablets at 57 minutes, and finally desktop responses at 62. – Yahoo “Evolution of Conversations in the Age of Email Overload” (April 2015)
Work email is 40% less likely to be checked on a smartphone than personal email . 35% check mobile email on a smartphone, compared to 59% who do so for personal email. Adobe “Email Use 2017 – US Report“ (2018)
Responses sent from mobile devices are 60% shorter than responses sent from desktop. Responses from phones are 20 words on average, responses from tablets are 27 words, and responses from desktops are 60 words. – Yahoo “Evolution of Conversations in the Age of Email Overload” (April 2015)
3. Mobile Email by Industry
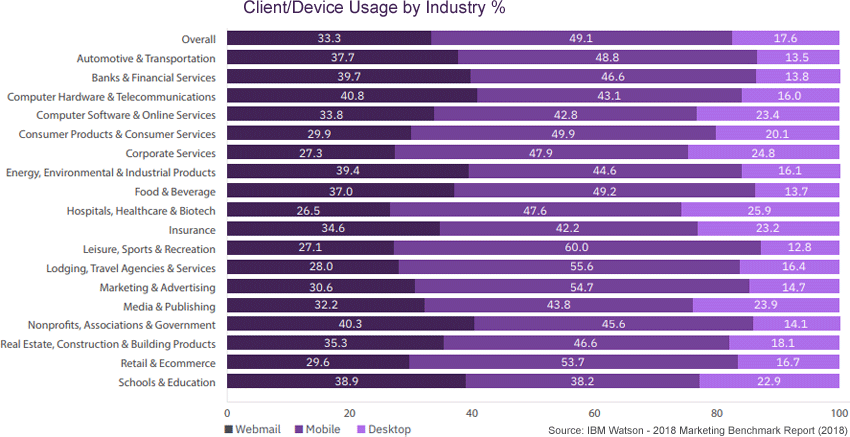
Mobile readers are diverse across industries. Entertainment, Sports & Recreation has the highest mobile email readership at 60.0% . This makes sense for entertainment industries as they naturally attract a young and mobile audience. –IBM Watson Marketing “2018 Marketing Benchmark Report” (2018)
Schools & Education has the lowest mobile email readership at 38.2% . – IBM Watson Marketing “2018 Marketing Benchmark Report” (2018)
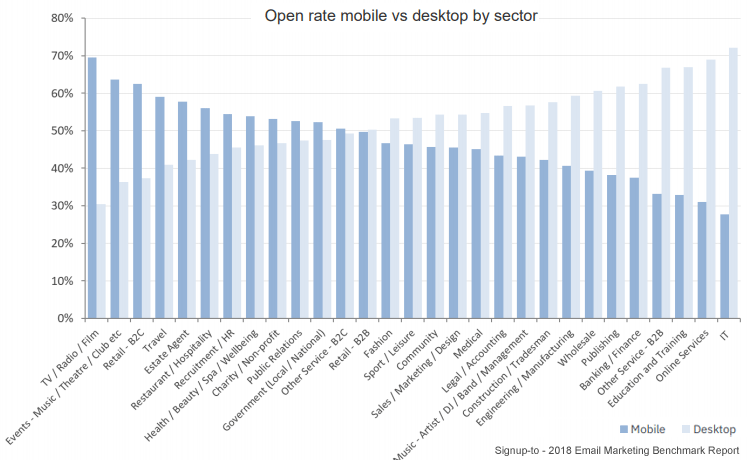
The TV/Radio/Film, Events, and B2C Retail sectors show the highest mobile email consumption . – Sign-up.to “2018 Email Marketing Benchmark Report” (2018)
Education and Training, Online Services and IT show the lowest mobile email opens and usage. – Sign-up.to “2018 Email Marketing Benchmark Report” (2018)
12 of the 29 industries saw an increase in mobile open rates with the biggest difference being in the following industries: – B2B Retail (+14.14%) – Sales / Marketing / Design (+13.27%) – Engineering / Manufacturing (+7.56%) – Engineering / Manufacturing (+7.56%) – Sign-up.to “2018 Email Marketing Benchmark Report” (2018)
19 out of 29 industries showed an increase in mobile click-through rates with the biggest difference being in the following industries: – Fashion (+16.79%) – Sales/Marketing/Design (+16.79%) – Health/Beauty/Spa/Wellness (+16.79%) (12.08%) – Sign-up.to “2018 Email Marketing Benchmark Report” (2018)
B2C emails receive 47.8% more mobile opens than B2B emails , ranking 46% of mobile opens for B2C vs. 24% for B2B. –DDMA “Nationale email benchmark 2018” (2018)
Energy 28.38%, Healthcare 25.75% and Finance 23.70% are the three industries with the highest mobile open rates in the Netherlands. –e-village & Clang “Email benchmark 2018” (Netherlands, 2019)
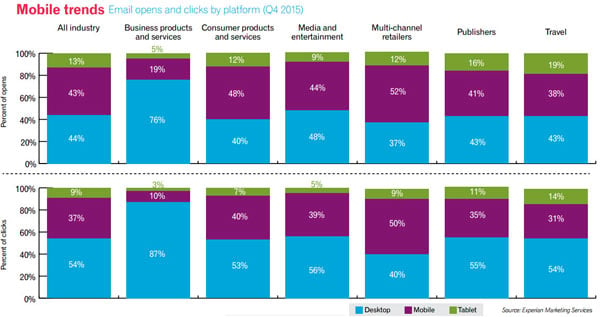
The majority of email opens occur on mobile phones or tablets for all industries except business products and services. – Experian “Quarterly email benchmark report” (Q4 2015).
Only multi-channel retailers had 50% of all clicks occur on mobile or tablet in Q4 2015. – Experian “Quarterly email benchmark report” (Q4 2015)
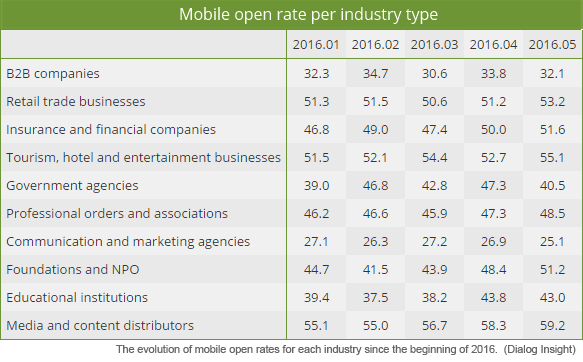
The top 3 industries with average mobile email open rates in Canada are Content and Media Distributors with 59.2%, Travel, Hospitality and Leisure Businesses with 55.1% and Retail Commerce Businesses with 53.2% – Dialog Insight “Mobile email open rates: Are you in the top 3?” (2016).
Emails from B2B companies (32.1%) and media and marketing agencies (25.1) in Canada have the lowest mobile open rates – Dialog Insight “Mobile email open rates: Are you in the top 3?” (2016).
4. Mobile email statistics by country
Nearly half (49.1%) of all emails are read on mobile devices worldwide , with some regions significantly higher or lower. The UK region continues to have the highest mobile readership at 62.9%, nearly double that of Latin America and the Caribbean at 31.4%. – IBM Watson Marketing “2018 Marketing Benchmark Report” (2018)
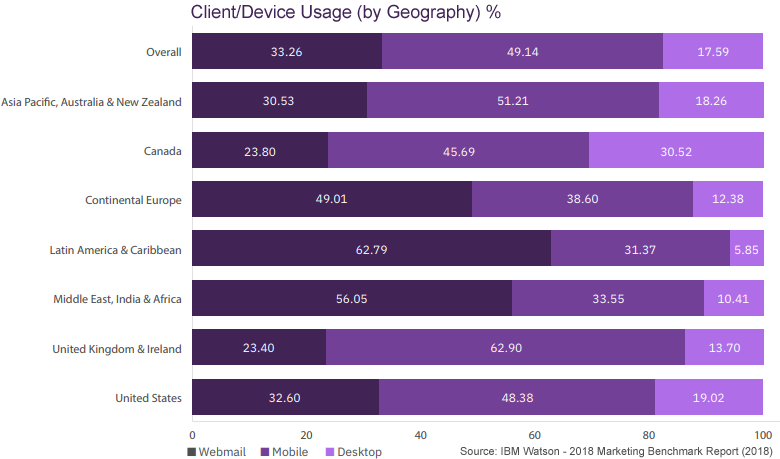
Desktop penetration remains highest in North America with Canada at 30.5% and the US at 19.0%. – IBM Watson Marketing “2018 Marketing Benchmark Report” (2018)
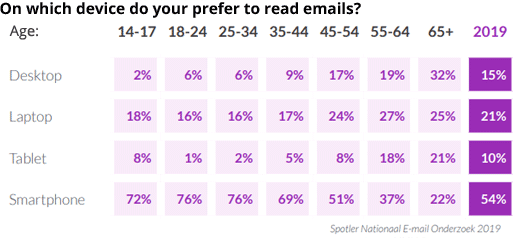
More than half of the Dutch population – over 54% – read e-mail most often on their smartphones. Spotler –“Nationaal E-mail onderzoek 2019” (2019)
37% of all email campaigns are opened on mobile devices in the Netherlands. 63% on desktop in the Netherlands– DDMA – “Nationale E-mail Benchmark 2019” (2019)
60% of emails opened are on mobile devices in the Netherlands . Mobile email is becoming more popular, a year ago it was 55.48%. – e-village & Clang “Email benchmark 2018” (2019)
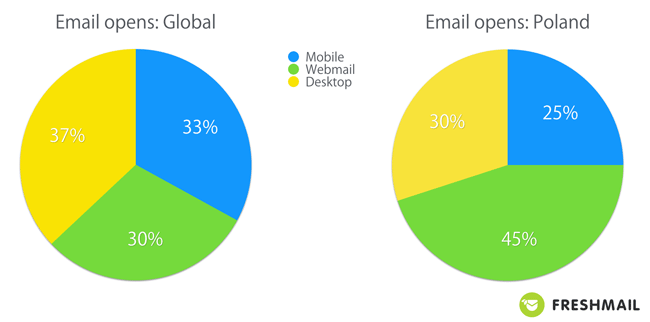
37% of email opens are on Desktop, 30% on webmail and 33% on mobile across countries. – Freshmail requested exclusively for “The Ultimate Mobile email statistics overview” (2016)
Poland has a low percentage of people checking email on mobile devices . With 45% of emails opened on webmail, 30% on desktop and only 25% on mobile. – Freshmail requested exclusively for “The Ultimate Mobile email statistics overview” (2016)
5. When and where do people check email on mobile devices?
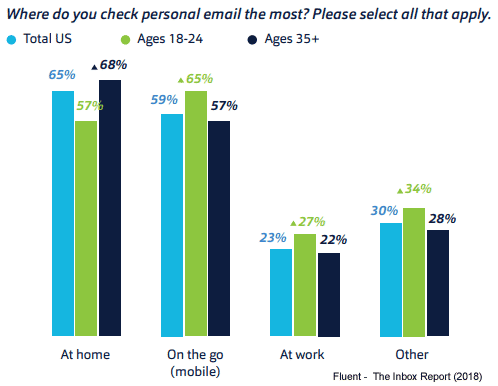
59% of respondents check their personal email on the go (on mobile devices), while 65% check their email at home. – Fluent ”The Inbox report, Consumer perceptions of email” (2018)
60% of respondents check their work email on their smartphone and 14% on their tablet , while 57% check their work email on their laptop/desktop. –Fluent ”The Inbox report, Consumer perceptions of email” (2018)
18-34 year olds are more likely to use email on mobile devices. 60% of 18-24 year olds check work email on their smartphone , 65% check personal email on the go (mobile). – Fluent ”The Inbox report, Consumer perceptions of email” (2018)
Email campaigns sent outside of business hours are more likely to be opened on mobile devices. – DDMA “Nationale E-mail Benchmark 2019” (Netherlands, 2019)
On workdays, most emails are opened on mobile devices in the evening between 17:00 and 21:00 (48% of opens on mobile devices). On weekends, mobile opens peak in the morning between 06:00 and 08:00 (with 52% of opens on mobile devices). – DDMA “Nationale E-mail Benchmark” (Netherlands, 2019)
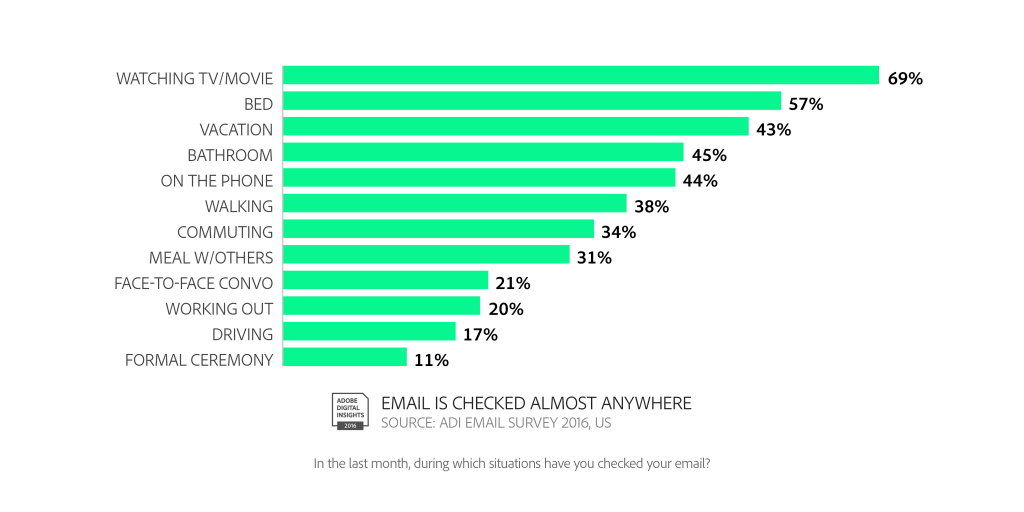
Americans love to multitask with email. They check email while watching TV or movies (69%), in bed (57%), and on vacation (79%). –Adobe digital Insights “ADI Email Survey 2016”
A quarter of Americans say they regularly check email until they go to bed, with 3% actually waking up in the middle of the night to check messages. –Adobe digital Insights “ADI Email Survey 2016”
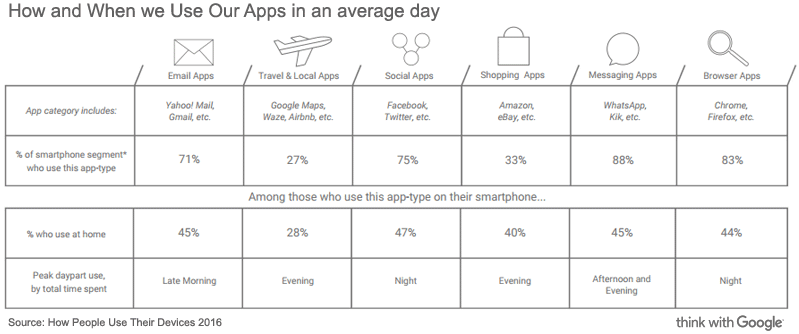
Late morning is the peak time for smartphone email usage, measured by total time spent. – Google “How People Use Their Devices 2016 – What Marketers Need to Know” (Sept 2016)
Of those who use email apps on their smartphones, only 45% use them at home. – Google “How People Use Their Devices 2016 – What Marketers Need to Know” (Sept 2016)
In a given hour of active phone use, users interact with 4.8 apps – Google “How People Use Their Devices 2016 – What Marketers Need to Know” (Sept 2016)
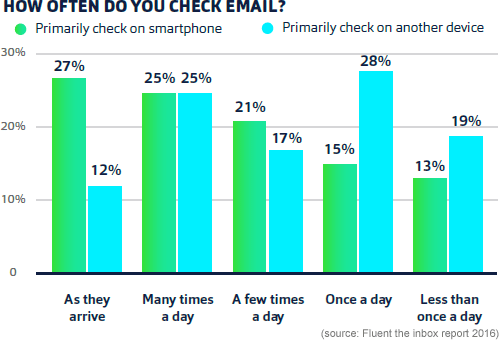
Nearly 3 in 4 (73%) smartphone users check their email more than once a day, 19% higher than those who primarily check on other devices. – Fluent ”The Inbox report 2016, Consumer perceptions of email” (2016)
27% of users primarily check email on their smartphones and do so when emails arrive. – Fluent ”The Inbox report 2016, Consumer perceptions of email” (2016)
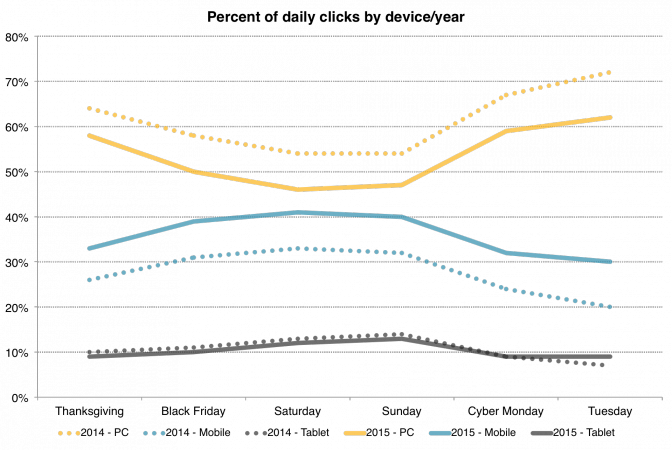
During the holidays, desktop engagement has dropped significantly as mobile engagement has increased. If this trend continues in 2016, we will see mobile engagement surpass desktop engagement by 10-15%. – Mailchimp “A MailChimp Record: 1.2 Billion Emails on Black Friday” (Dec 2015)
6. Mobile Email Conversions, Revenue, and Purchases
31% prefer to shop online on their smartphone, up from 22% a year earlier. With laptops (40%), desktops (23%), tablets (10%) being the devices people prefer to shop online on in the Netherlands. – Spotler – “Nationaal E-mail onderzoek 2019” (2019)
41% of marketers find email to be the most effective way to get deals to mobile consumers while shopping during the holiday season. –Adobe “Adobe digital insights – holiday shopping trends” (2019)
Men have the highest conversion rates on mobile emails in the afternoon, while women convert the most in the morning. – Live Intent “The People Behind the Screens: A Marketer’s Guide to Mobile Audiences” (2015)
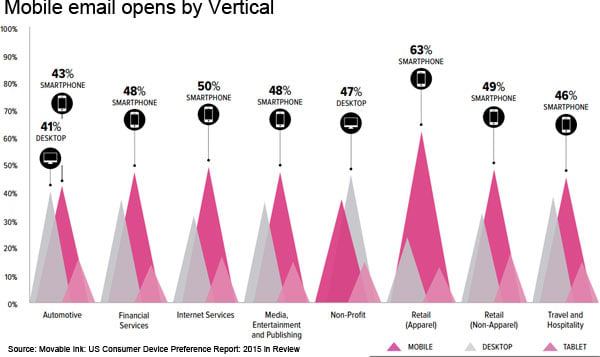
Smartphone open rates remain strong for both apparel and non-apparel retail. Apparel retail saw the highest smartphone conversion rate (40%) of all verticals we track. AOV also grew by over $43 across all apparel retail devices. – Movable Ink “Consumer Device Preference Report Q1 2017” (2017)
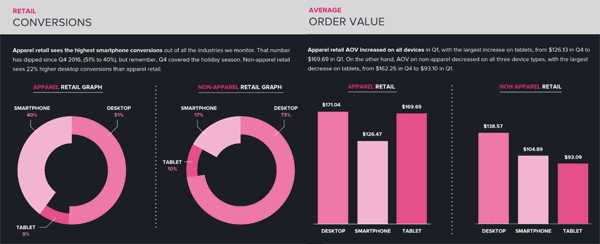
Shoppers spend more on desktop. Desktop conversions result in an average order value for apparel purchases that is 26% higher than on mobile. Non-apparel shoppers spend even more on desktop, spending 24.3% more per order than on mobile. – Movable Ink “Consumer Device Preference Report Q1 2017” (2017)
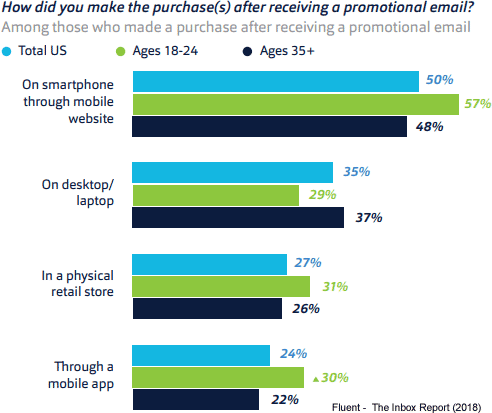
After viewing a marketing email, half of consumers (50%) purchased via a mobile website, 24% via a smartphone app, 35% on a computer, and 27% in-store. – Fluent ”The Inbox report 2016, Consumer perceptions of email” (2018)
People with a general interest in Shopping have the highest open rates, click-through rates, and conversion rates in the evening. – Live Intent “The People Behind the Screens: A Marketer’s Guide to Mobile Audiences” (2015)
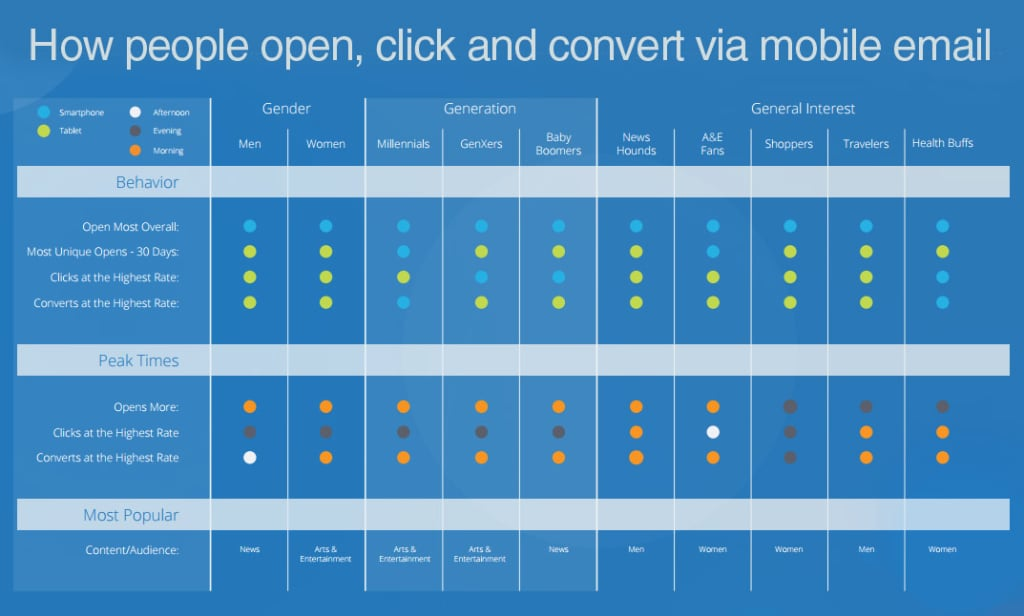
Shoppers have the highest mobile conversion rates via mobile devices in the evening. –Live Intent “The People Behind the Screens: A Marketer’s Guide to Mobile Audiences” (2015)
News buffs, entertainment fans, travelers, and health enthusiasts have the highest mobile email conversion rates in the morning. – Live Intent “The People Behind the Screens: A Marketer’s Guide to Mobile Audiences” (2015)
Millennials, GenXers, and Baby Boomers all convert best in the morning when it comes to mobile email. –Live Intent “The People Behind the Screens: A Marketer’s Guide to Mobile Audiences” (2015)
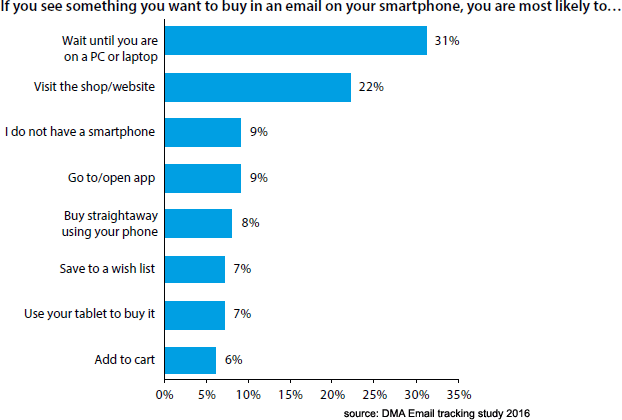
Nearly a third (31%) say they use their smartphone as their primary device for clicking and making purchases. As more websites cater to mobile users with responsive, mobile-ready websites, this percentage will continue to rise. – DMA “Consumer email tracking study 2016”
Despite the clear shift towards more smartphone usage, smartphones still struggle to complete simple tasks that are common on desktops. This idea is reinforced by consumer behavior. If a consumer sees something they want to buy on a smartphone, the top behavior is still to wait until they get to their PC or laptop (31%), followed by going to a store or website (22%). Only 8% will buy right away on their phone. – DMA “Consumer email tracking study 2016”
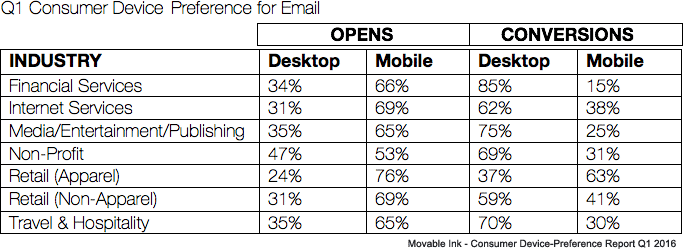
Financial Services Customers Use Desktop to Convert . Only 15% of financial services customers – the lowest rate of any industry – used mobile devices to purchase products and services in Q1. Travel and hospitality emails had the second highest desktop conversion rate at 70%. – Movable Ink “Consumer Device Preference Report Q1 2016” (2016)
On mobile, email marketing generates 26.7% of revenue, compared to 20.9% on desktop and 23.1% on tablets – Custora “ E-Commerce Pulse Mobile report” (2014)
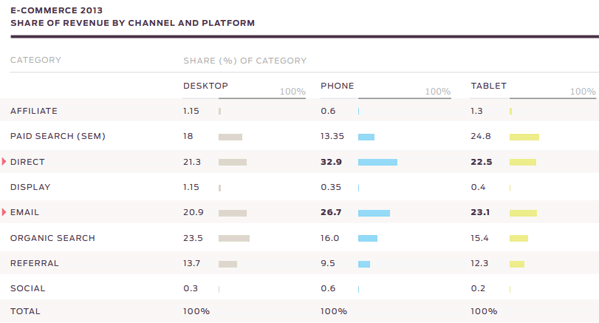
Email is the second largest revenue driver, both on mobile and tablet. – Custora “E-commerce Pulse Mobile report” (2014)
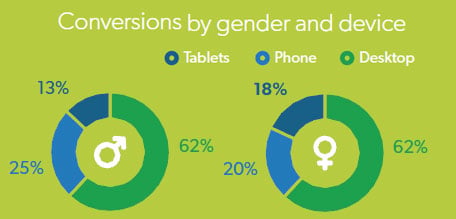
Women have a stronger preference for converting on tablets, with 18% converting, compared to 13% for men. Liveintent – “Email Everywhere: Adapting to the Mobile Nature of Email Q1 2014 Report” (2014)
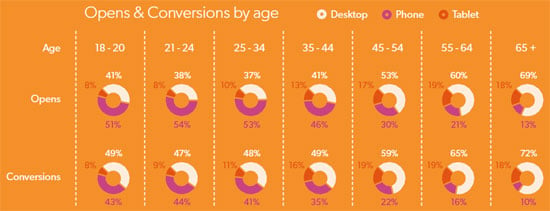
Mobile conversion rates are 43% for 18-20 year olds and just 10% for 65+ year olds. Mobile email open rates are 51% for 18-20 year olds and just 13% for 65+ year olds. Mobile opens and conversions drop further for older age groups. Liveintent – “Email Everywhere: Adapting to the Mobile Nature of Email Q1 2014 Report” (2014)
Average Order Value (AOV) for mobile increased 28% in one year , double the annual growth of AOV on desktop – Yesmail “Email Marketing Compass: The Season of Mobile” (2015)
With only 20% of mobile clicks from email , the iPad generates 48% of mobile email transactions , making it the mobile device with the highest conversion rate.- Experian Marketing Services “The 2014 Digital Marketer Trend report” (2014)
The iPhone is the most commonly used mobile device for email opens (68%) and clicks (58%) . The iPhone generates 40% of mobile email transactions. – Experian Marketing Services “The 2014 Digital Marketer Trend report” (2014)
Mobile revenue accounts for 20% of total email-generated revenue , up 1/3 in a year. – Yesmail “Email Marketing Compass: The Season of Mobile” (2015)
Android accounts for 20% of unique clicks on mobile emails and 12% of mobile email conversions. – Experian Marketing Services “The 2014 Digital Marketer Trend report” (2014)
Revenue per click on mobile emails is 40 cents, more than double that of desktop clicks . – Yesmail “Email Marketing Compass: The Season of Mobile” (2015)
Email-generated purchases made on Android smartphones have increased nearly 50% year-over-year – Yesmail “Email Marketing Compass: The Season of Mobile” (2015)
Christmas is a tablet-centric holiday season with 20.10% of emails read on tablets . – Movable Ink “US Consumer Device Preference Report: Q4 2013” (2014)
On Thanksgiving, 59% of emails were viewed on smartphones. Cyber Monday saw a much higher desktop open rate than other holidays at 40.15%. – Movable Ink “US Consumer Device Preference Report: Q4 2013” (2014)
47.7% check email while watching TV. Making it the second most popular second screen activity after web surfing (49%)- W3B report – “Second Screen – Mediating TV and Internet” (2014)
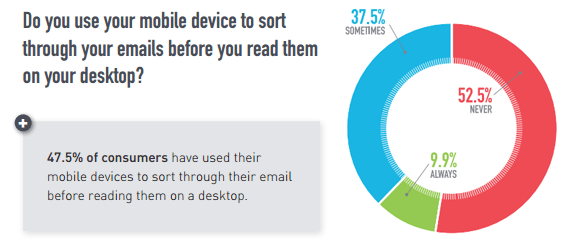
47.5% of consumers used their mobile device to organize emails before reading them on desktop.- BlueHornet “Consumer Views of Email Marketing” (2014)
7. Optimize mobile email
If you’re looking to optimize your messages for mobile, be sure to check out this collection of free responsive email templates.
Nearly 1 in 5 B2B email campaigns are not optimized for mobile SuperOffice “The state of B2B email marketing” (Nov 2020)
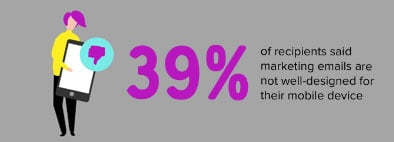
39% of recipients find marketing emails are not designed properly for their mobile devices . – 250OK and 42labs “What recipients really think about your email marketing designs” (2018)
26.6% of recipients find “how it fits on my screen” an important factor in email design. – 250OK and 42labs “What recipients really think about your email marketing designs” (2018)
80% of brands always send mobile and tablet optimized emails . 12% sometimes send mobile optimized emails, while 8% do not optimize emails for mobile. –e-village & Clang “Email benchmark 2018” (Netherlands, 2019)
Brands barely optimize emails for smartwatches . Of those brands, only 2% always send and 7% sometimes send emails optimized for smartwatches. – e-village & Clang “Email benchmark 2018” (Netherlands, 2019)
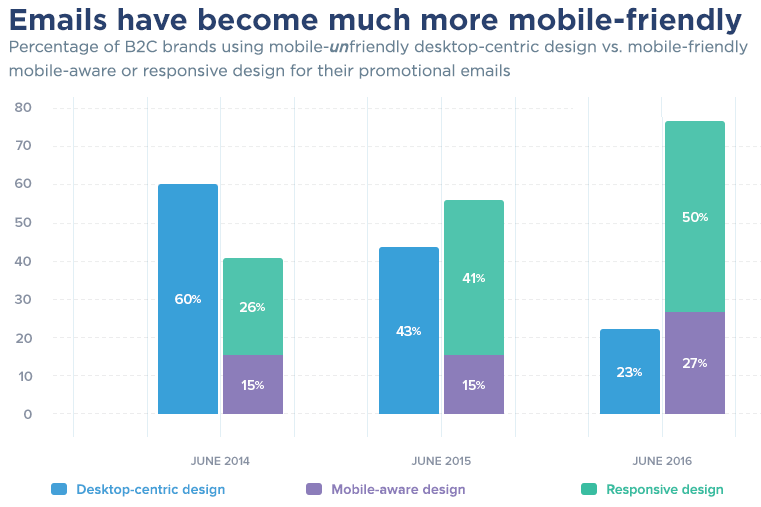
23% of emails had a desktop-centric email design in June 2016. Down from 43% in June 2015 and 60% in June 2014. –Litmus and Salesforce Marketing cloud “2016 Mobile-Friendly Email & Landing Page Trends” (2016)
Mobile-friendly email design accounted for 27% of emails in June 2016. Up from 15% in June 2015 and 15% in June 2014 –Litmus and Salesforce Marketing cloud “2016 Mobile-Friendly Email & Landing Page Trends” (2016)
Responsive email design usage increased to 50% in June 2016. This number was 41% in June 2015 and 26% in June 2014 – Litmus and Salesforce Marketing cloud “2016 Mobile-Friendly Email & Landing Page Trends” (2016)
73% of marketers are prioritizing email optimization for mobile devices – Econsultancy “The Email Marketing Industry Census 2017” (2017)
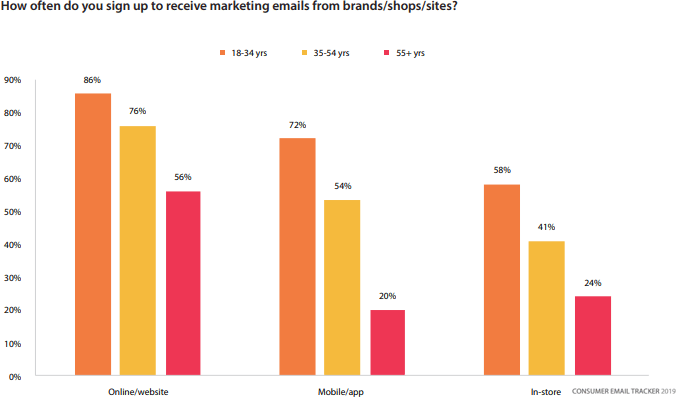
On average, 47% will use their mobile device to sign up for marketing emails. 72% do this online and 40% do it in-store. –DMA “Consumer email tracker 2019” (2019)
In general, younger customers are more likely to sign up, and especially via mobile. –DMA “Consumer email tracker 2019” (2019)
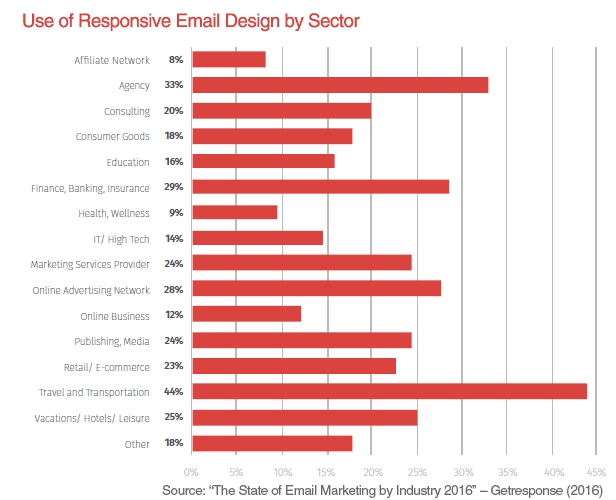
32% of marketers say they preview emails in multiple email clients and browsers, including mobile devices, before sending. “The State of Email Marketing by Industry 2016” – Getresponse (2016)
Only 17% of marketers use responsive email design or use device-aware coding. “The State of Email Marketing by Industry 2016” – Getresponse (2016)
Click-to-open rates are 40% higher for brands that send exclusively responsive emails (14.1%) than for brands that send only non-responsive emails (10.1%). – Yesmail “Email Marketing Compass: The Season of Mobile” (2015)
66% of marketers claim to have deployed mobile-optimized templates. However, only 18% of marketers have templates that support dynamic content, allowing you to personalize each email. – Getresponse “The State of Email Marketing by Industry 2016” (2016)
51.6% of e-commerce emails from the top 20 ESPs in the US are sent with responsive design, 48.4% are non-responsive. – Publicare “The Publicare Email Marketing Benchmark” (2016)
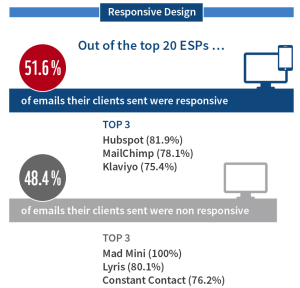
Email response adoption varies by ESP. In e-commerce Hubspot (81.9%) Mailchimp (78.1%) and Klaviyo (75.4%) are the ESPs that send the highest email response rates. – Publicare “The Publicare Email Marketing Benchmark” (2016)
72% of enterprise email marketers say they are using responsive design, 27% say they plan to or expect to. – Forrester Research “Global Email Marketing Customer Reference Online Survey” (2014)
Thirty-seven percent of all emails deployed in Q4 2014 were responsive, up 28% from Q3 2014. – Yesmail “Email Marketing Compass: The Season of Mobile” (2015)
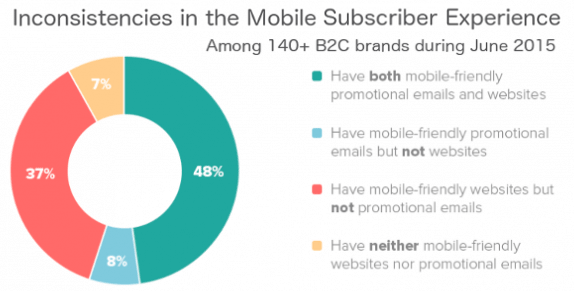
48% of B2C brands have both mobile-friendly promotional emails and mobile-friendly websites. – Litmus “Inconsistencies in the Mobile Subscriber Experience” (2015)
37% of B2C brands have mobile-friendly websites but no mobile-friendly promotional emails. – Litmus “Inconsistencies in the Mobile Subscriber Experience” (2015)
When marketers optimize their messages for mobile, they design fully responsive emails (an average of 69.77%). – flexmail “Email barometer 2015 – 2016 report Belgium” (2016)
Optimize 30.23% for mobile by increasing text and button size or adjusting the current design to one column – flexmail “Email barometer 2015 – 2016 report Belgium” (2016)
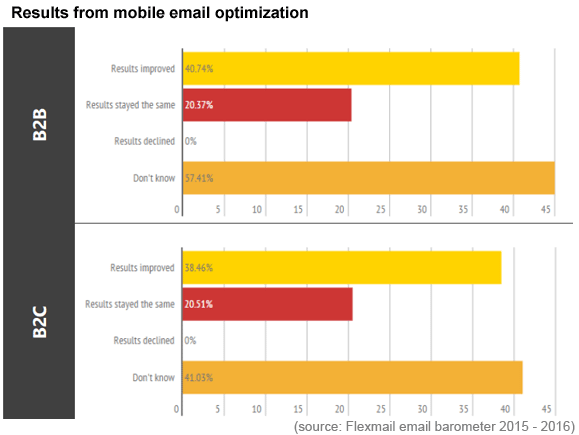
57.41% of marketers in B2B and 41.03% in B2C do not know what impact optimizing email design for mobile devices has on their results . – flexmail “Email barometer 2015 – 2016 report Belgium” (2016)
Mobile optimization has a positive impact on email campaign results for 40.74% of B2B marketers and 38.46% of B2C marketers. – flexmail “Email barometer 2015 – 2016 report Belgium” (2016)
Desktop-focused design is predicted to be less popular than responsive design by December 2014, with only 30% of emails focused on desktop first. – Exact Target “The growing adoption of mobile friendly design” (2014)
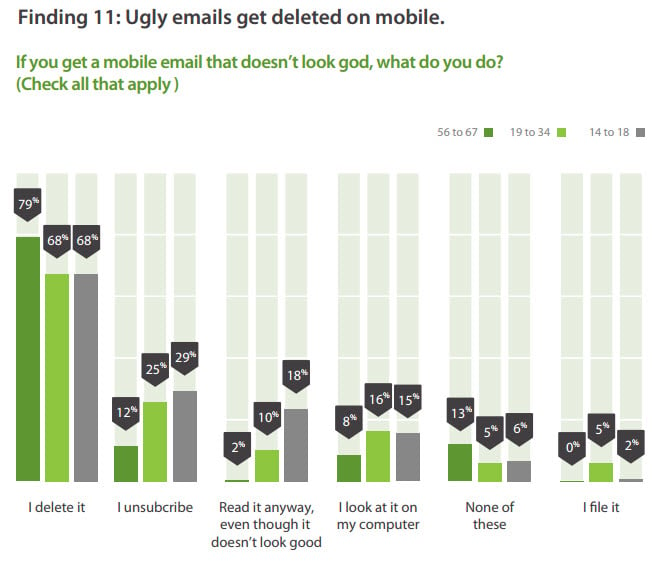
71.6% of consumers will delete an email if it doesn’t look good on a mobile device , while an average of 10% will read it. – Adestra “Consumer Adoption & Usage Study” (2016)
15.5% of smartphone users aged 56-67 use their smartphones most for email (personal or business). – Adestra “Consumer Adoption & Usage Study” (2017)
Email is the primary smartphone activity for 10.3% of 19-34 year olds, – Adestra “Consumer Adoption & Usage Study” (2017)
83.8% use smartphones for personal email, 34.0% use smartphones for work email. – Adestra “Consumer Adoption & Usage Study” (2017)
45% of consumers have unsubscribed from promotional emails because the email or website didn’t work well on their smartphone – Litmus and Fluent “2016 Mobile-Friendly Email & Landing Page Trends” (2016)
34% of consumers have marked promotional emails as spam because they don’t work well on their smartphones – Litmus and Fluent “2016 Mobile-Friendly Email & Landing Page Trends” (2016)
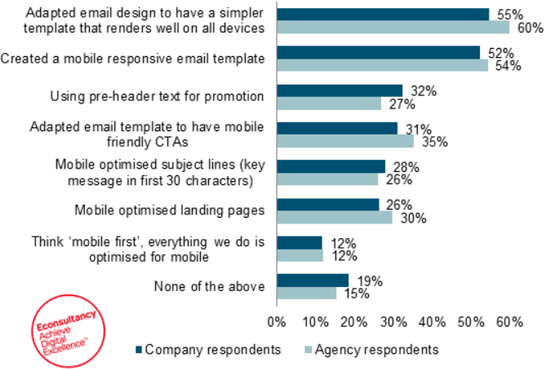
52% of marketers have adapted their email designs to be simpler and display well on all devices –eConsultancy – “Email Marketing Industry Census” (2015)
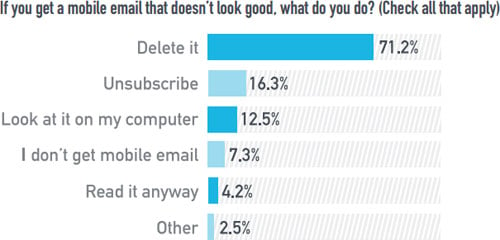
If an email is displayed incorrectly, 71.2% will delete it immediately. BlueHornet “Consumer Views of Email Marketing” (2014)
52% of marketers have created mobile-responsive email templates – eConsultancy – “Email Marketing Industry Census” (2015)
32% of marketers optimize for mobile using pre-header text for promotions, 28% have mobile-optimized subject lines. – eConsultancy – “Email Marketing Industry Census” (2015)
41% of brands send mobile-friendly emails, yet 75% use mobile-friendly landing pages – ExactTarget “Mobile Friendly disconnects” (2014)
73% of brands that send emails at least daily send mobile-friendly emails – ExactTarget “Mobile Friendly disconnects” (2014)
37% of brands send fewer emails per day than mobile-friendly emails – ExactTarget “Mobile Friendly disconnects” (2014)
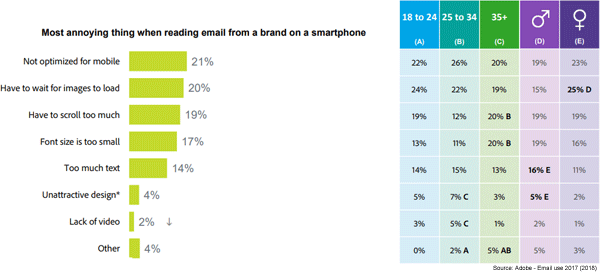
Respondents shared the most frustrating aspects of reading emails on smartphones, with about 20% citing not being optimized for mobile, having to wait for images to load, having to scroll too much, or fonts being too small as the top annoyances. Adobe “Email Use 2017 – US Report” (2018)
Reduce (30%) and Hide (26%) are the most popular mobile email design tactics for navigation. Reduce the number of navigation items or hide navigation altogether in retail emails when opened on mobile devices. –StyleCampaign “Responsive email navigation” (2014)
Top-down (16%) and Shift (16%) are commonly used design patterns for mobile navigation. Move the navigation from top to bottom or position it below the logo instead of next to it when opened on mobile. – StyleCampaign “Responsive email navigation” (2014)
8. Disclaimer of Party:
Feel free to share this article, but note that there are multiple ways to measure opens and market size for mobile emails. You can measure all opens, unique opens, or opens over a period of time (e.g., over a month).
Additionally, average mobile email usage is not the same as mobile email usage for your target audience or email list.
Basic mobile email usage statistics:
Mobile email will account for 26 to 78% of email opens, depending on your target audience, product, and email type. eMailmonday– “the Ultimate mobile email stats” (2021)
Comment Policy: We truly value your comments and appreciate the time you take to share your thoughts and feedback with us.

Note: Comments that are identified as spam or purely promotional will be removed.

To enhance your commenting experience, consider creating a Gravatar account. By adding an avatar and using the same e-mail here, your comments will feature a unique and recognizable avatar, making it easier for other members to identify you.

Please use a valid e-mail address so you can receive notifications when your comments receive replies.